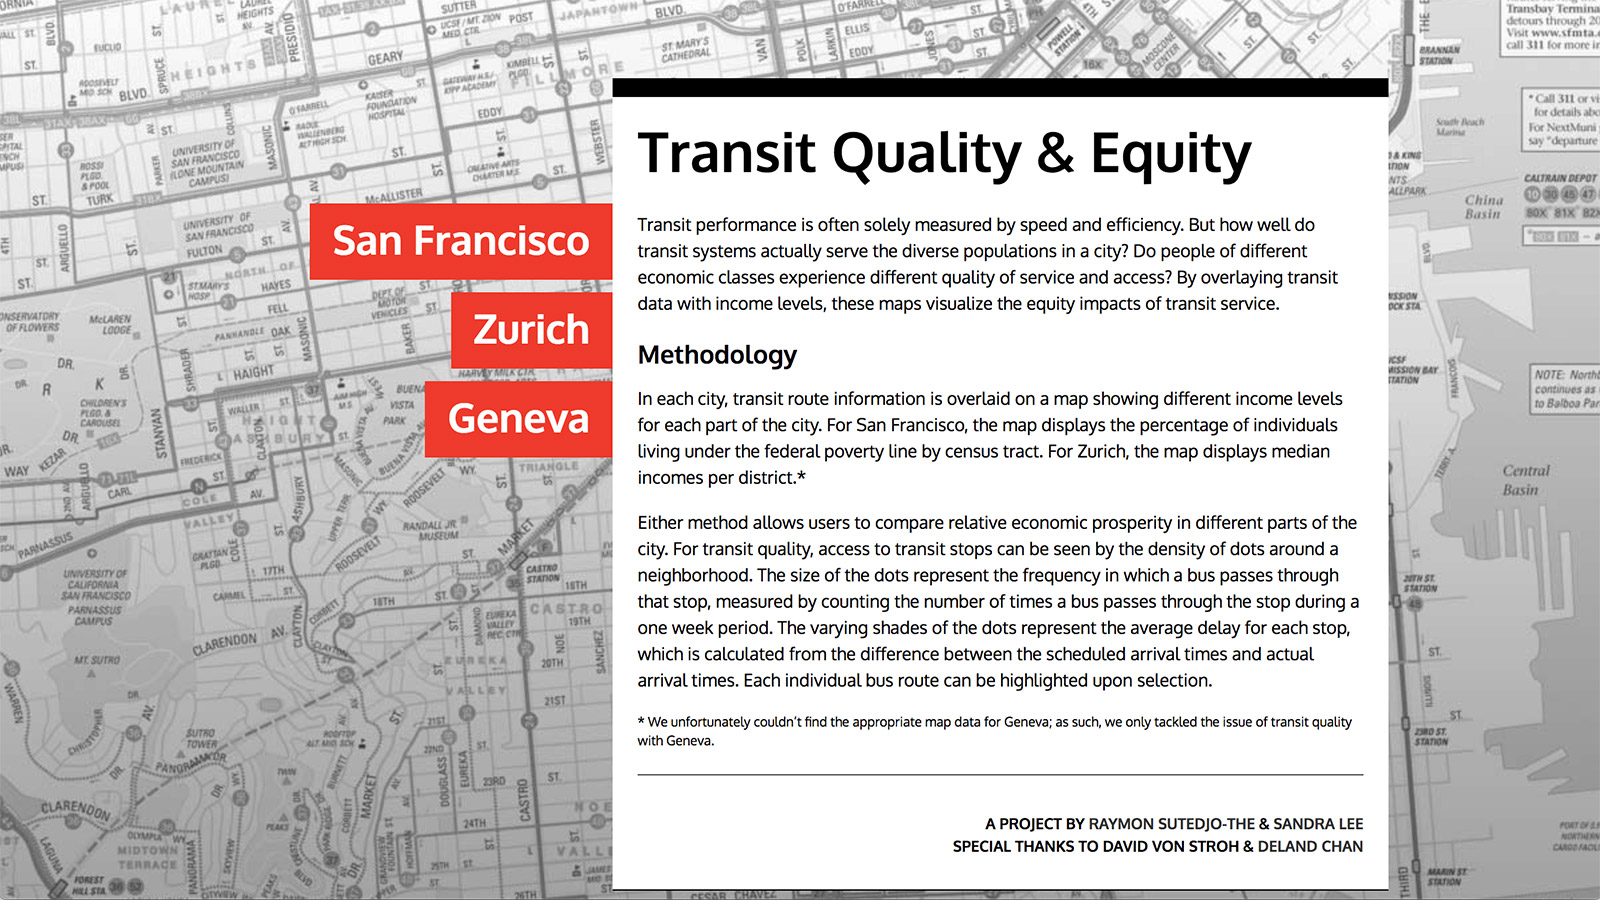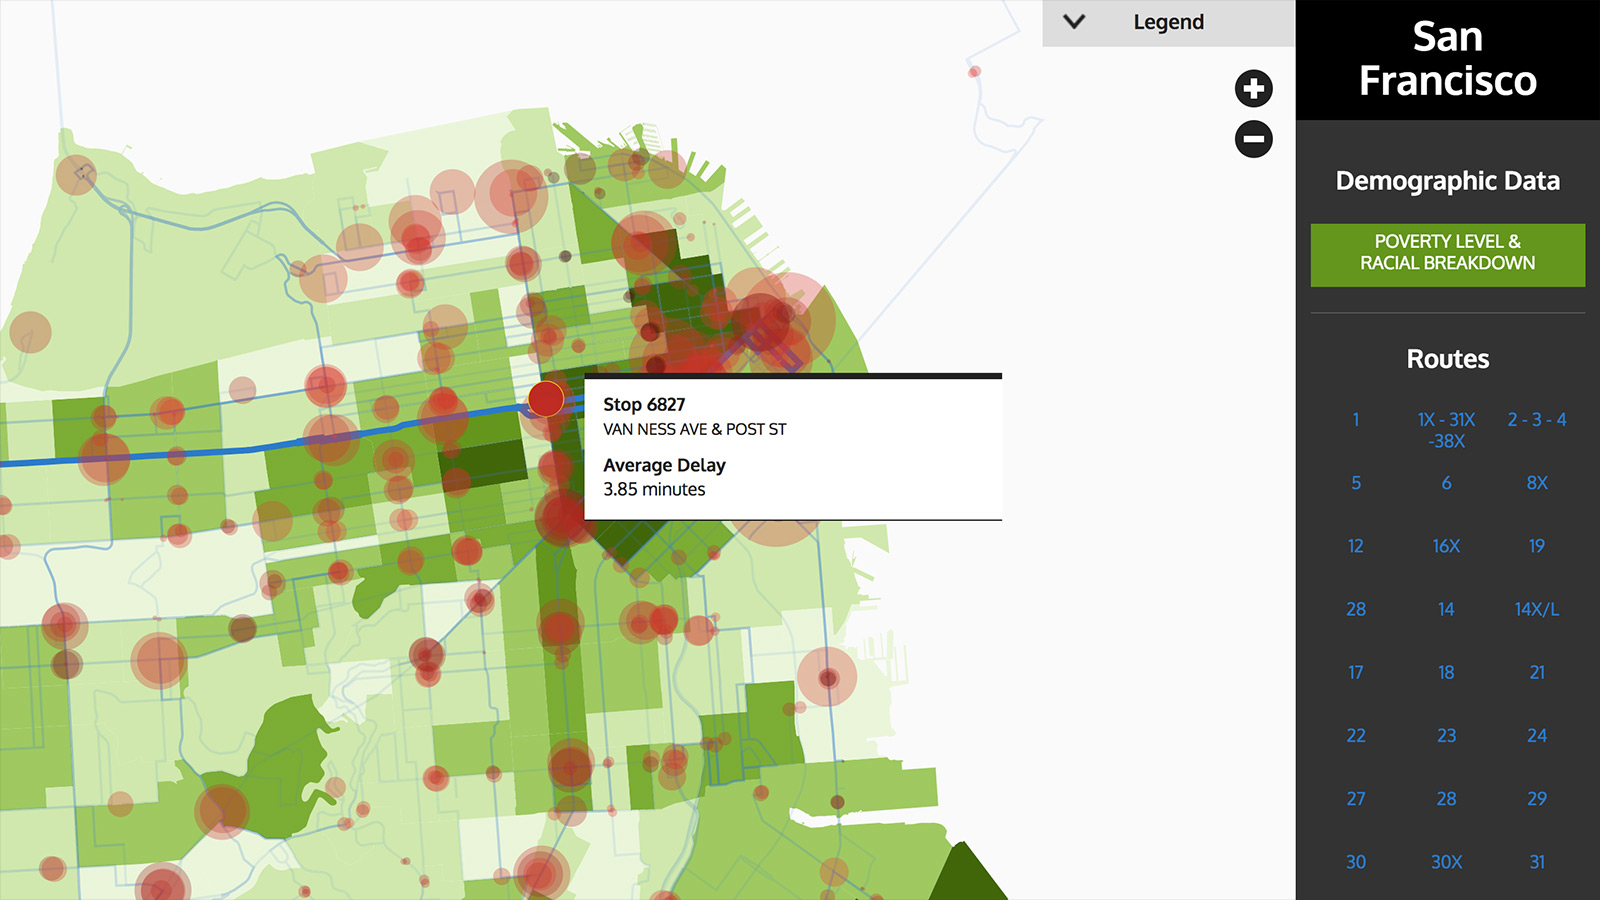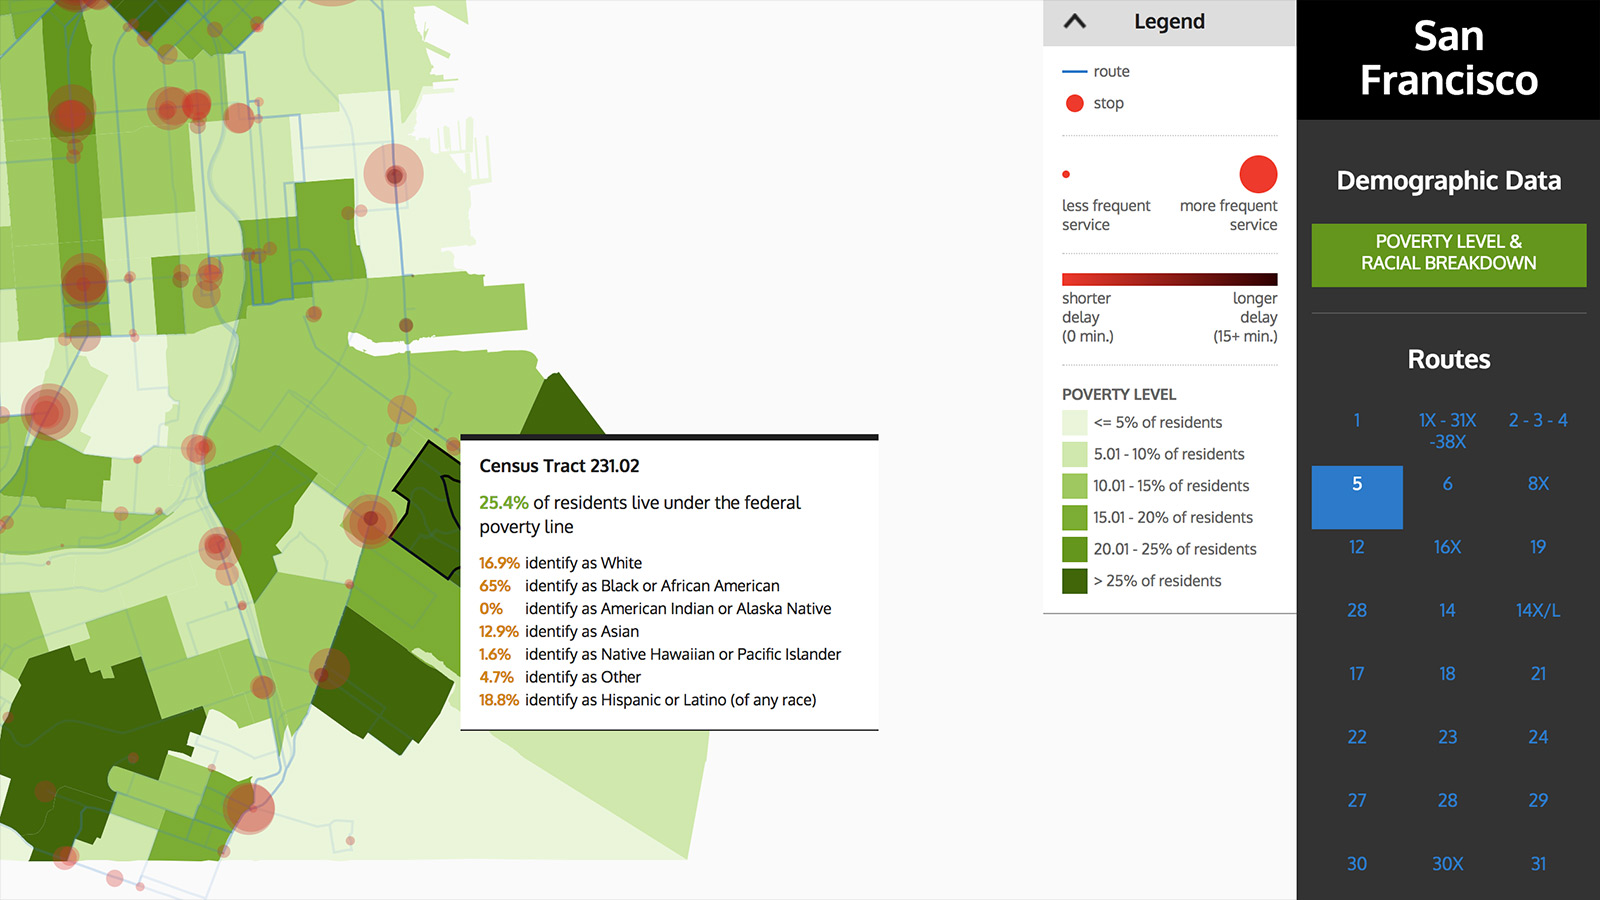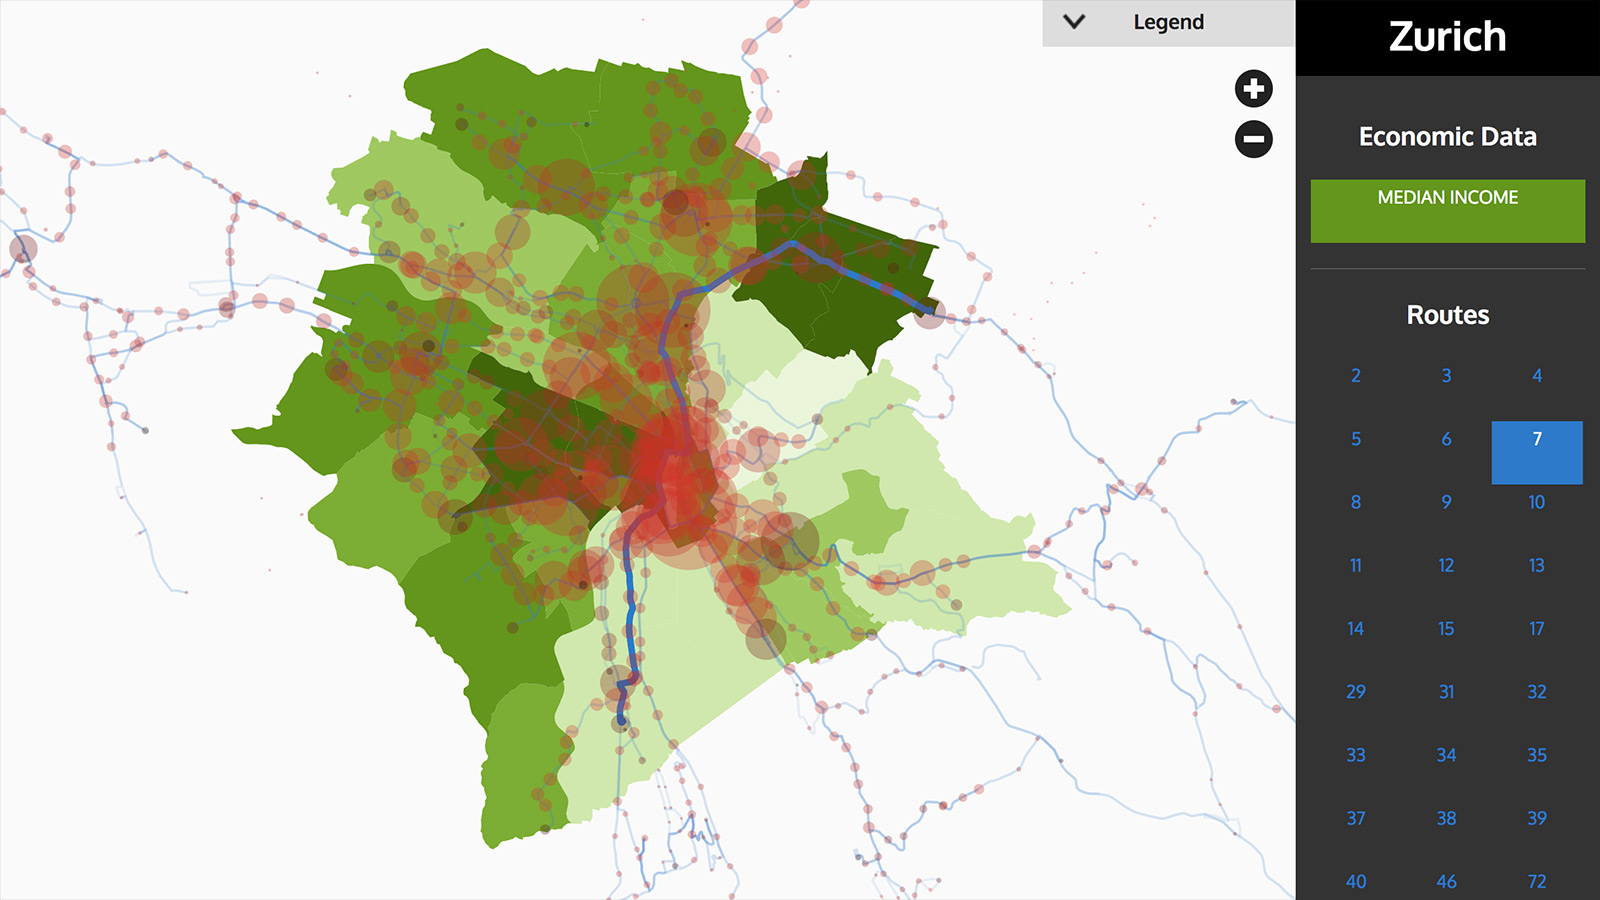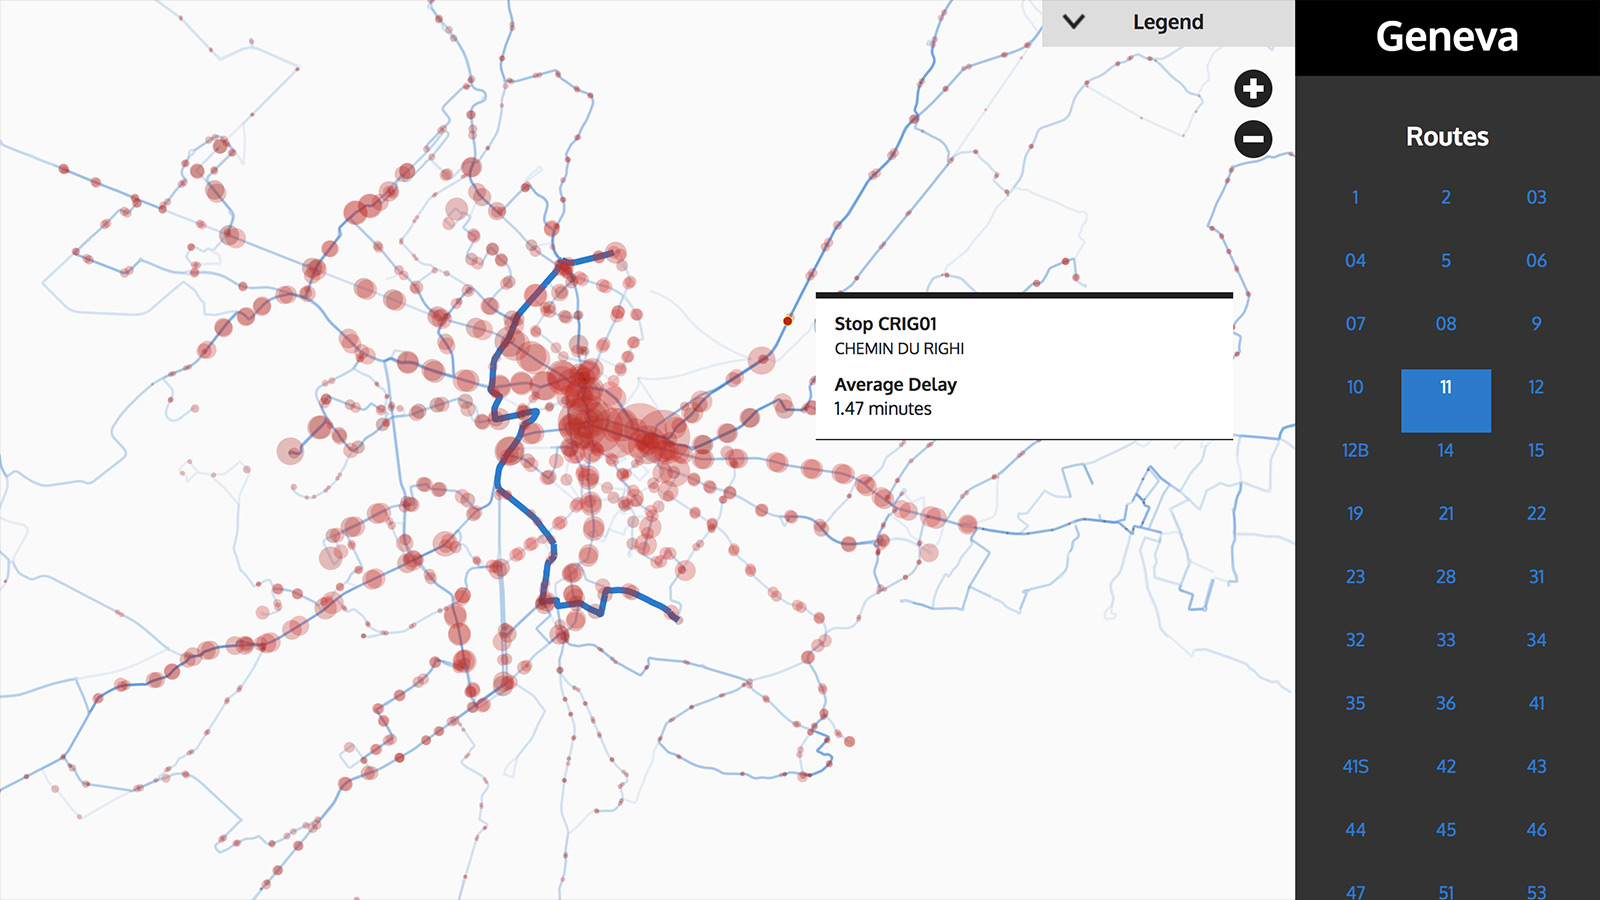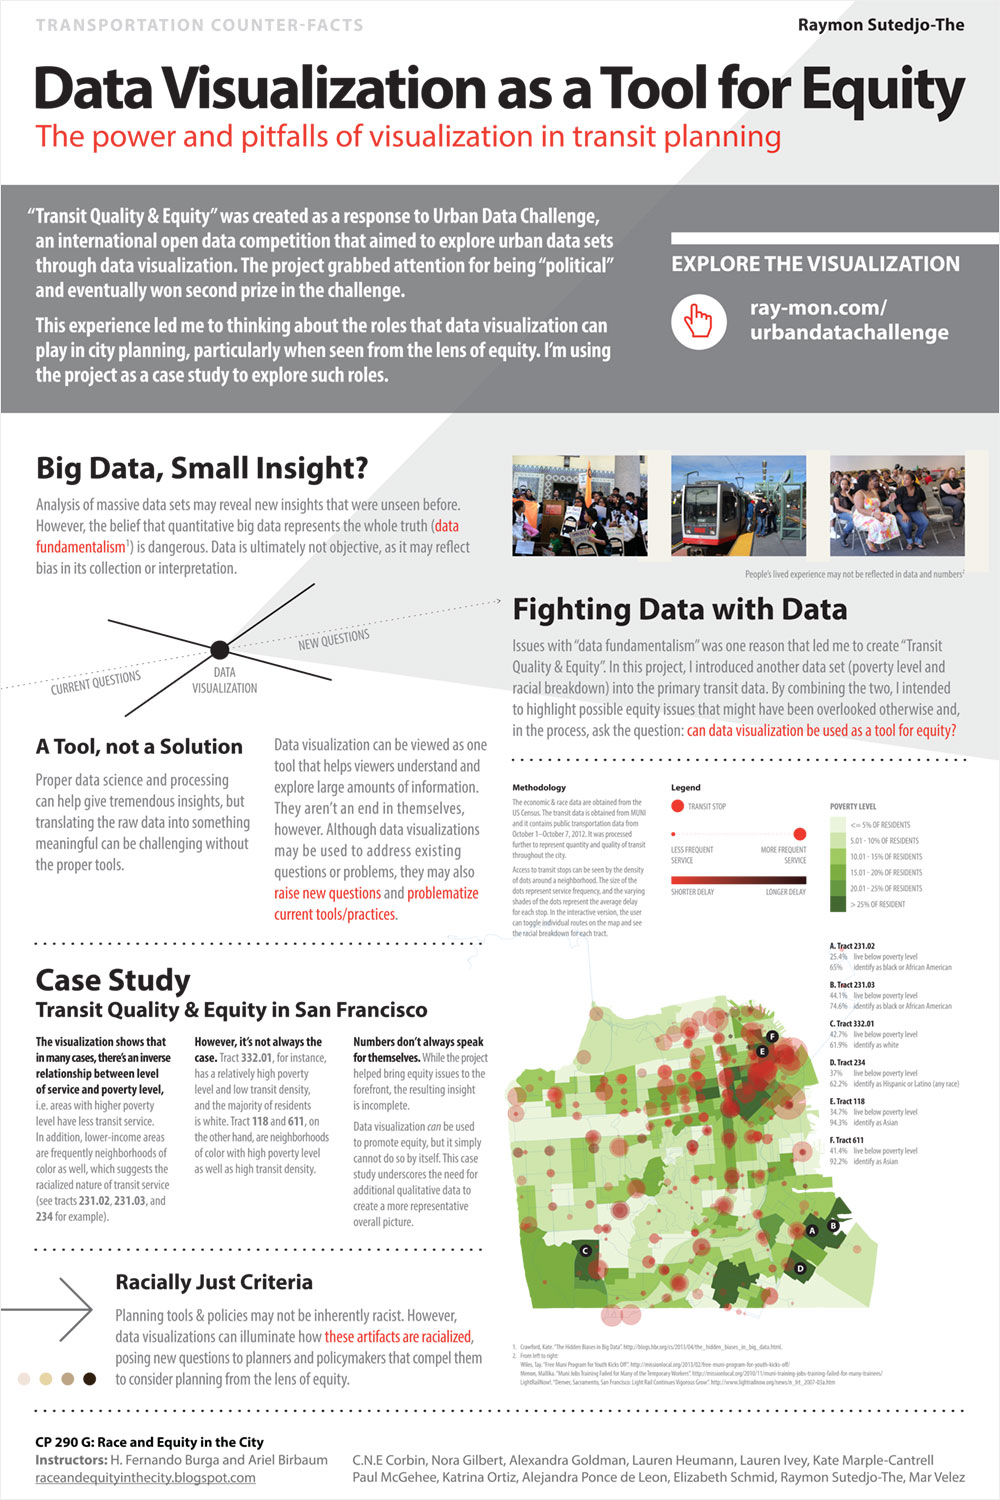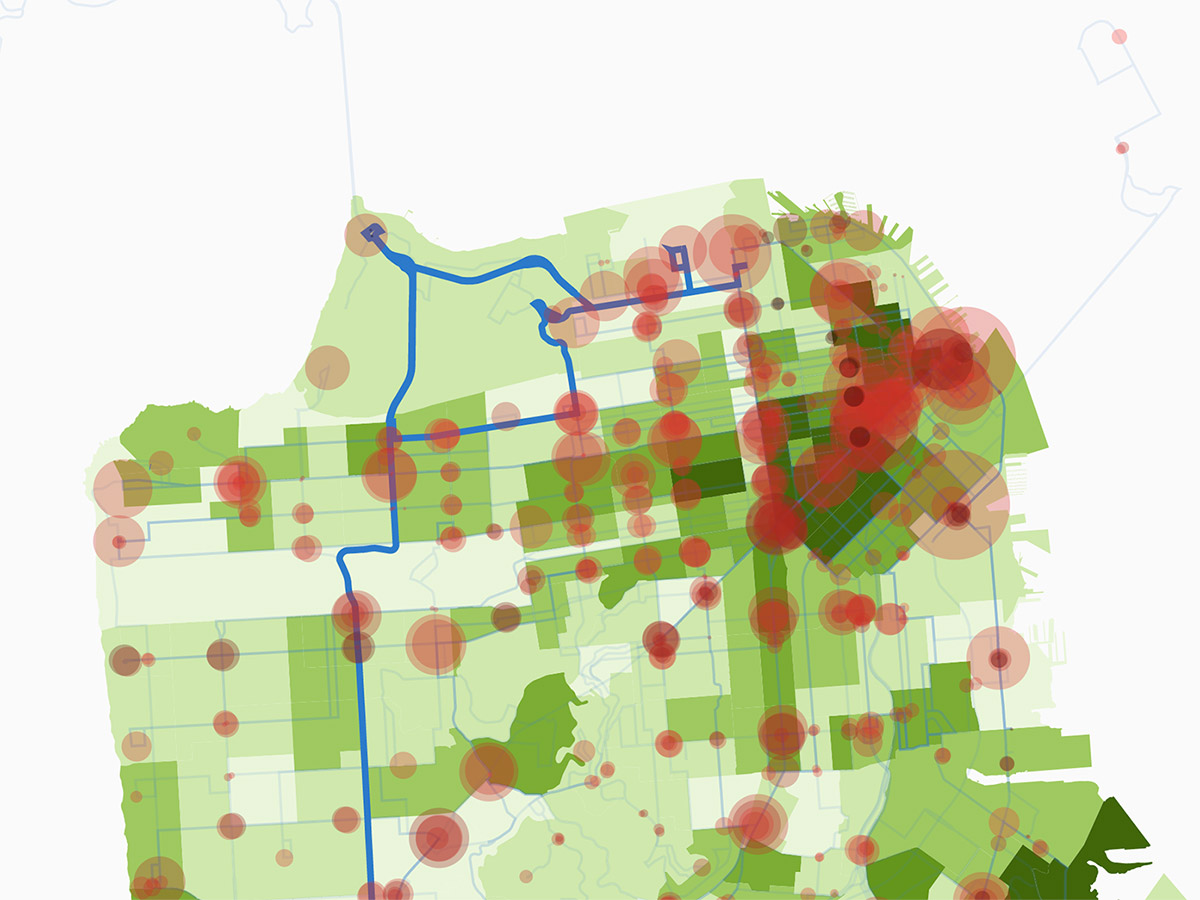
“Transit Quality & Equity” was created as a response to Urban Data Challenge, an international open data competition that aimed to explore urban data sets through data visualization. I chose to address this theme by looking at the question from the lens of equity, i.e. to see how well transit systems serve diverse populations in a city. To accomplish this, I layered economic and demographic data on top of transit data, which allows the users to draw relationships between transit quality and equity.
After the competition, I continued to expand the project. In one of my courses, I used it as a case study in investigating the role that data visualization could play in city planning.
The project has been featured on Citylab and Fast Company Design.